Retinal Vessel Segmentation and Diagnosis of Retinopathy of Prematurity (ROP) Disease Using Deep Convolutional Neural Networks
Github Link for this project
In this project, retinal vessel segmentation was achieved using both traditional computer vision techniques and CNN structure U-Net with transfer learning. Later, a graphical user interface was developed to allow medical specialists to label retinal image data. Lastly, the collected training data was used to train another U-Net network.
Keywords about the project:
- Image Processing
- Computer Vision
- Edge Detection
- Local threshold
- Morphological Operations
- Adaptive Contrast
- Segmentation
- Deep Learning
- Convolutional Neural Networks (CNN)
- Vessel Segmentation/Extraction
- Accuracy, ROC curve, confusion matrix, F1 Score, precision
- Jaccard similarity score
- Transfer Learning
- ImageNet
- DRIVE
- Python
- matplotlib
- numpy
- sklearn
- KERAS
- TensorFlow
- MATLAB
- Image Processing Toolbox
- Graphical User Interface (GUI)
More Information
To learn more about the project, please scroll down.
Retinal Vessel Segmentation
Two different approach was followed in order to segment retinal vessels.
1-) Segmenting Retinal Vessels Using Traditional Image Processing Techniques
MATLAB image processing toolbox is used to segment vessels using traditional computer vision approaches (edge detection, local threshold, morphological operations etc). Related scripts are segmentation and auto contrast and segmentation without auto contrast.
The approach followed for this purpose:
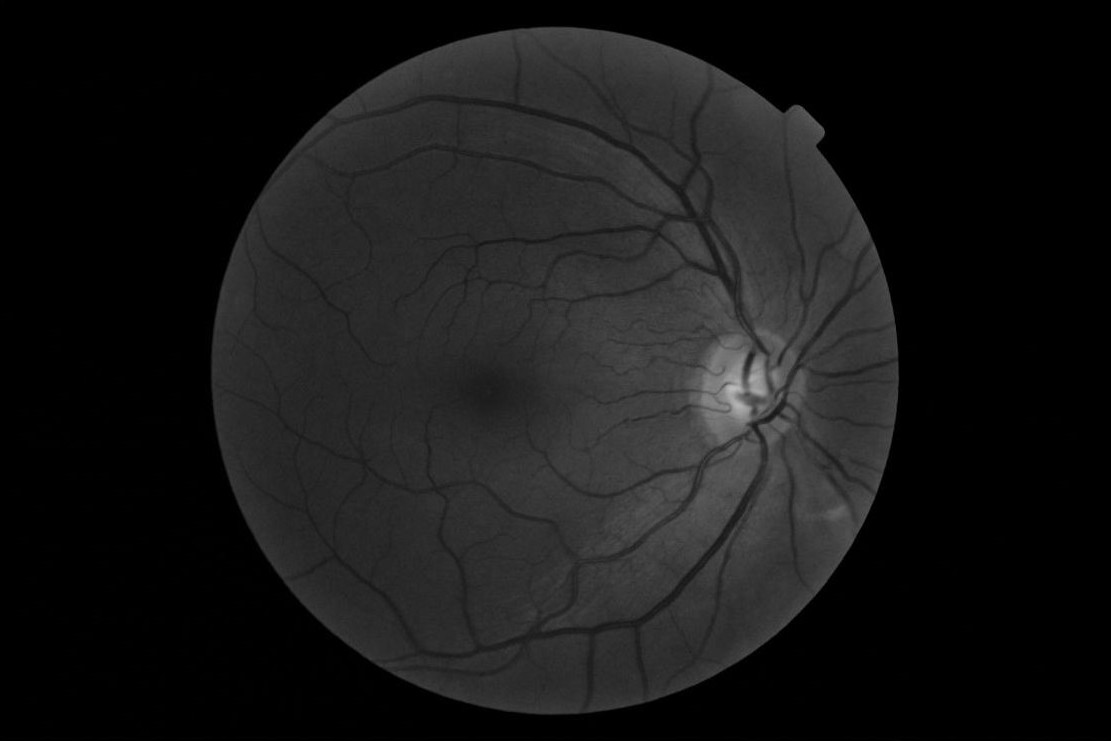
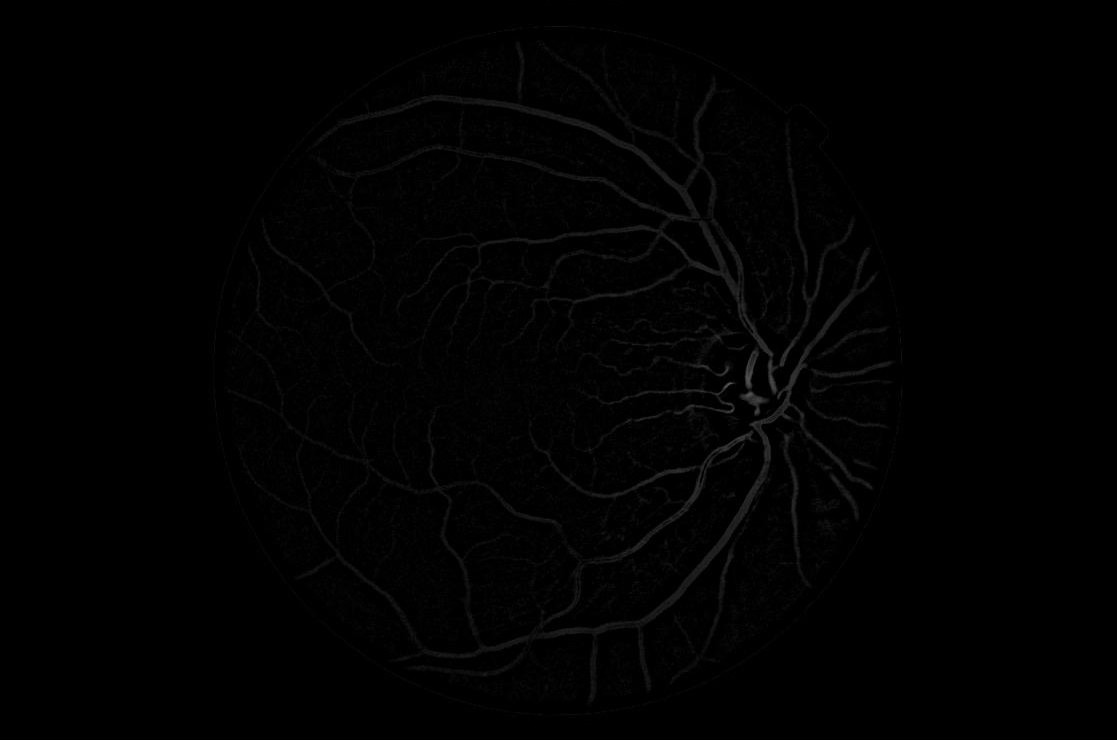
- Read original image and adjust contrast
- Filter edges and apply local threshold
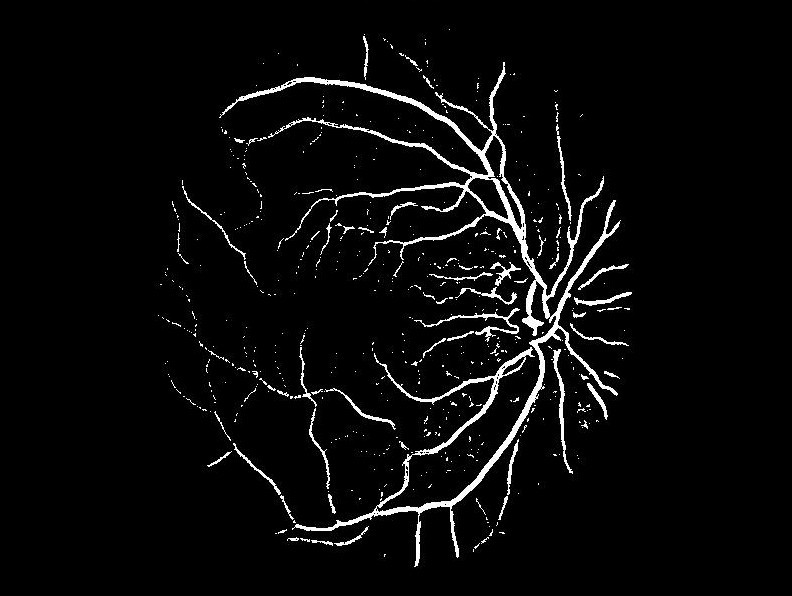
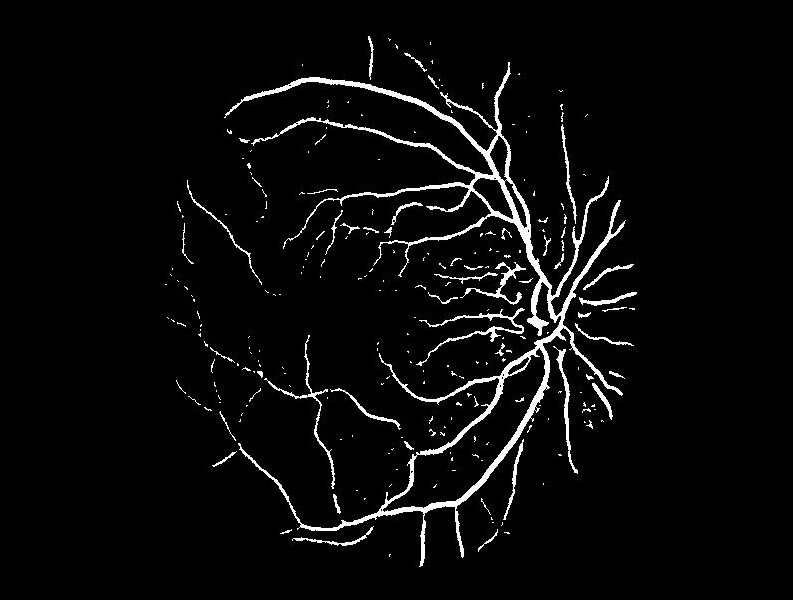
- Bridge the gaps with morphological operations and finally select the longest/thickest vessels to obtain final image
2-) Segmenting Using Convolutional Neural Network U-Net with Transfer Learning
-
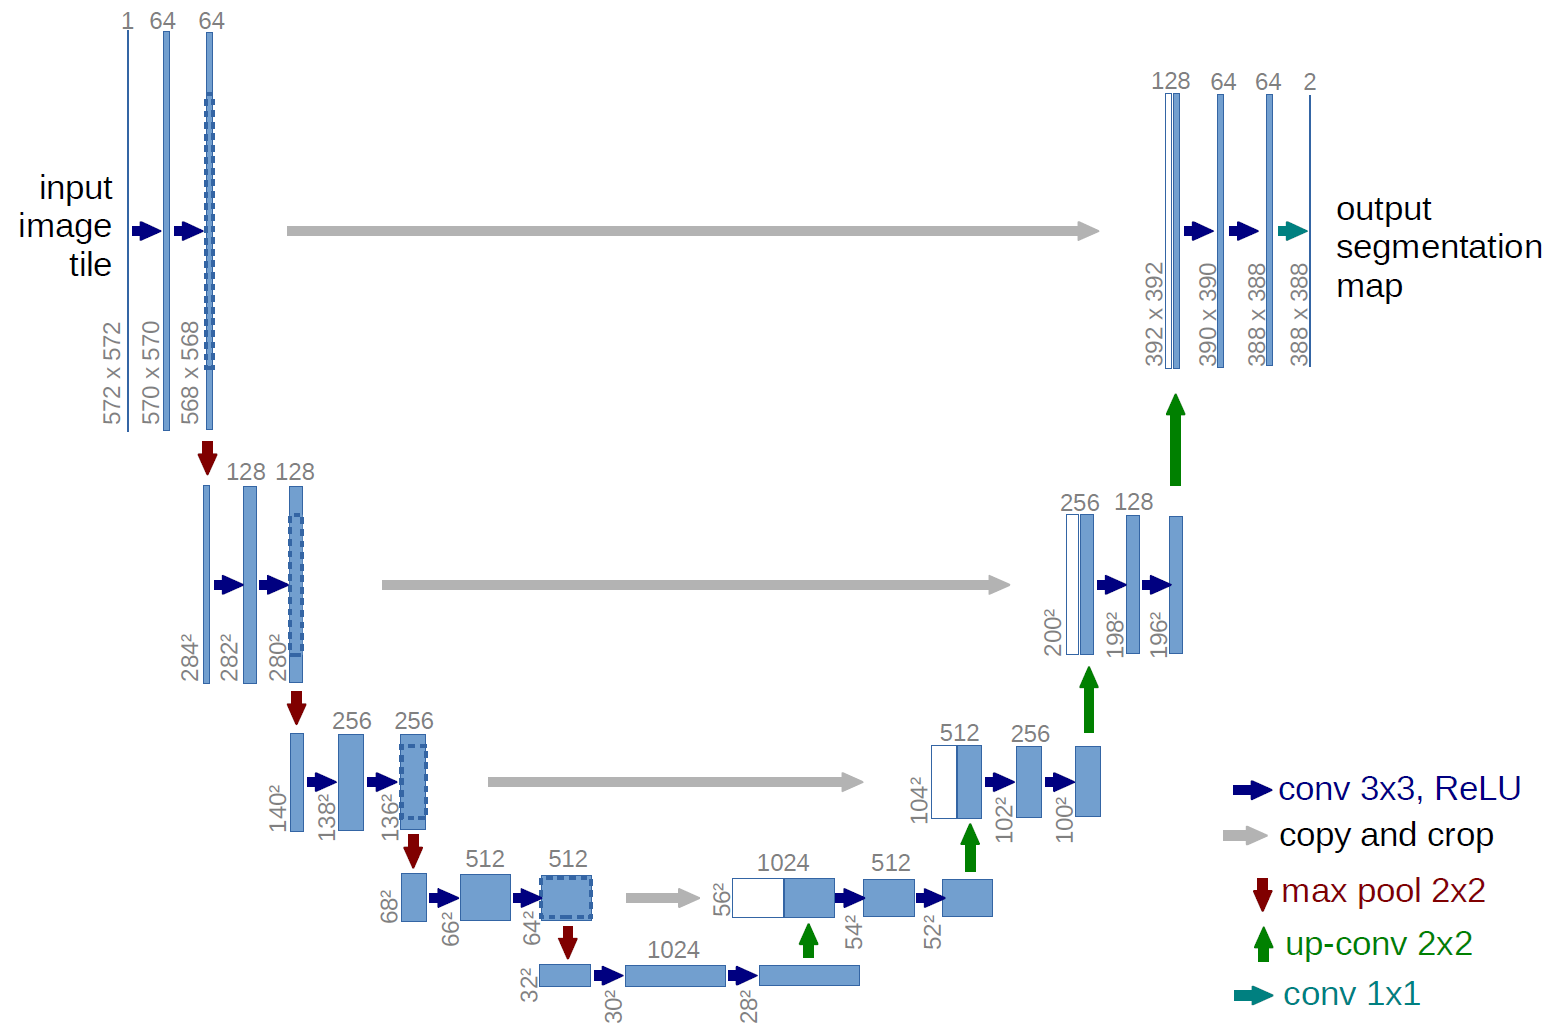
A CNN architecture aimed for segmentation named U-Net (as shown below) was used
-
Train it with Imagenet
-
Use trained U-Net network to train our network for DRIVE DATASET: Digital Retinal Images for Vessel Extraction –>transfer learning
-
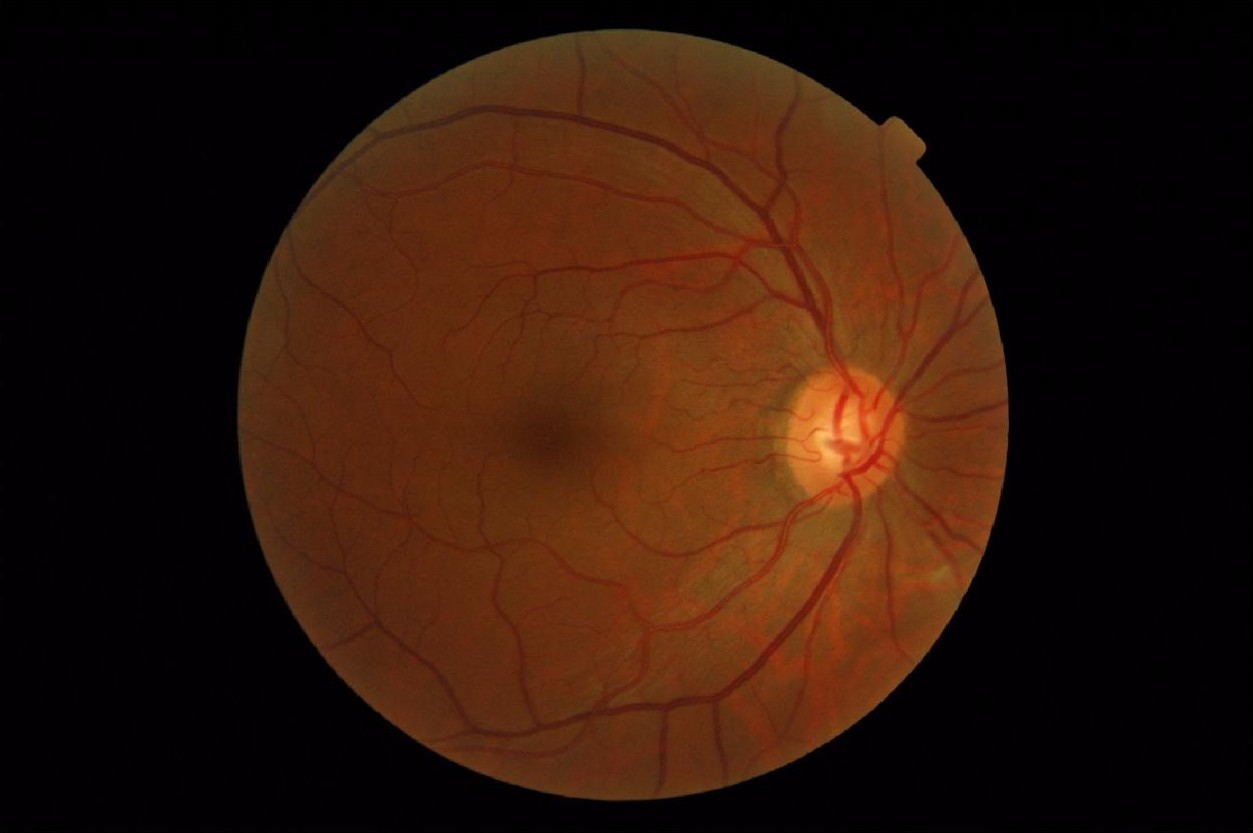
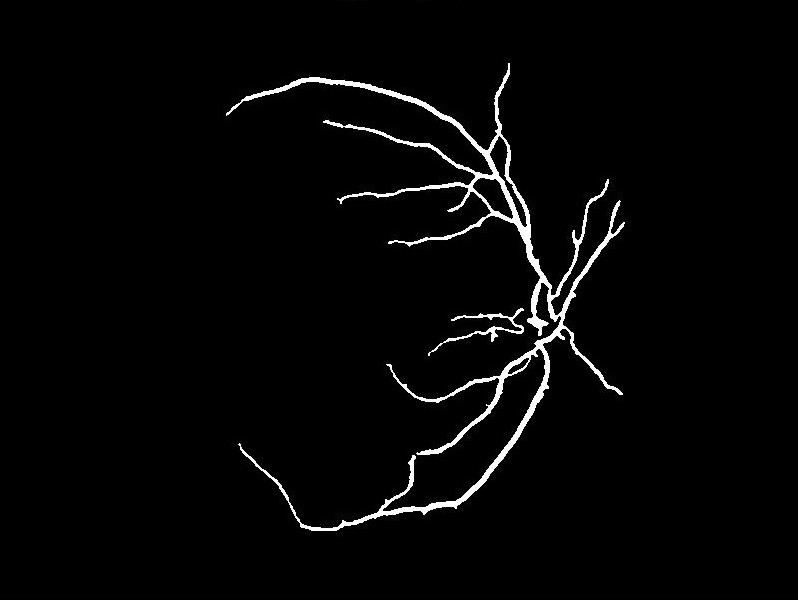
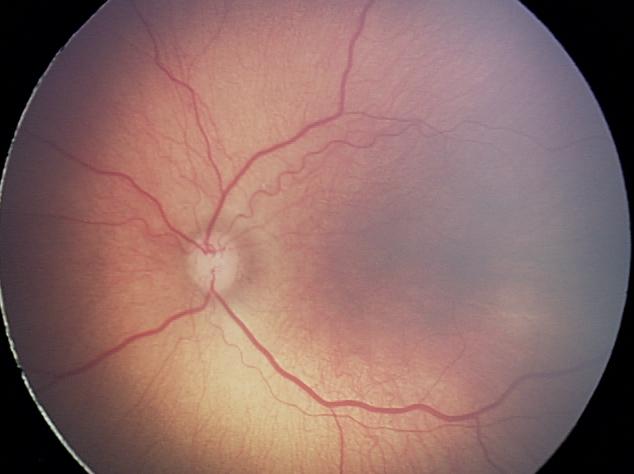
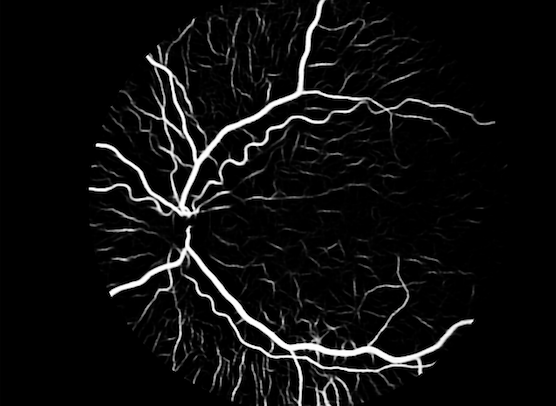
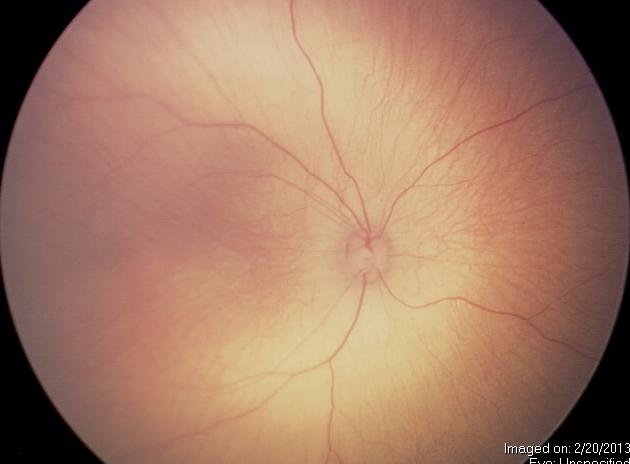
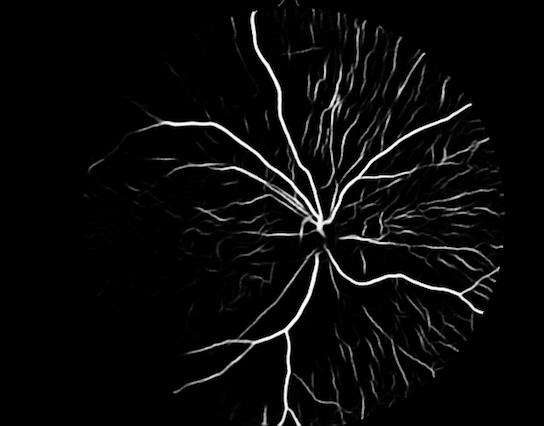
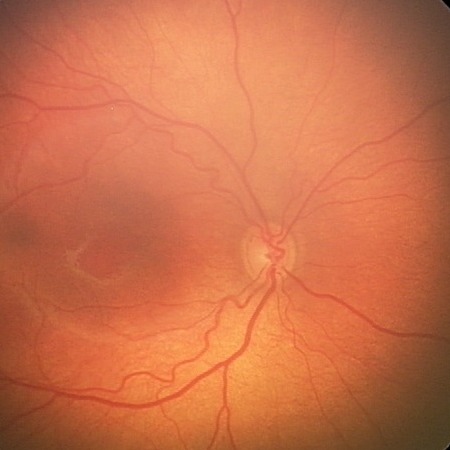
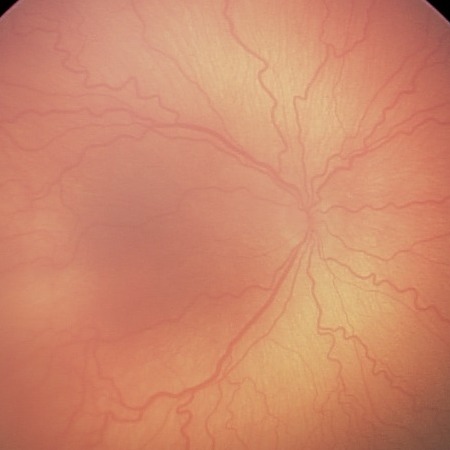
Here are example input-output pairs where left image is the original image and right image is the output of U-Net
Diagnosis of Retinopath of Prematurity (ROP) Using Segmented Vessels
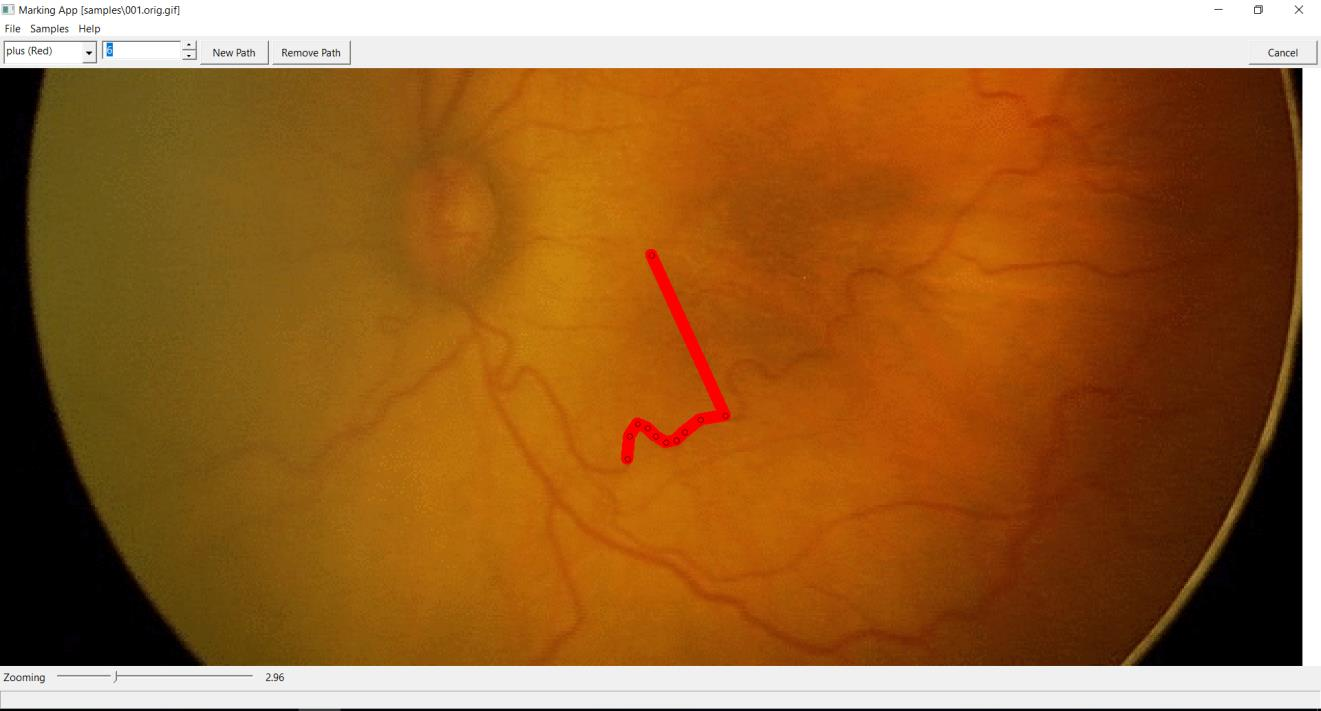
Marking App to Collect Training Data from ROP Specialists
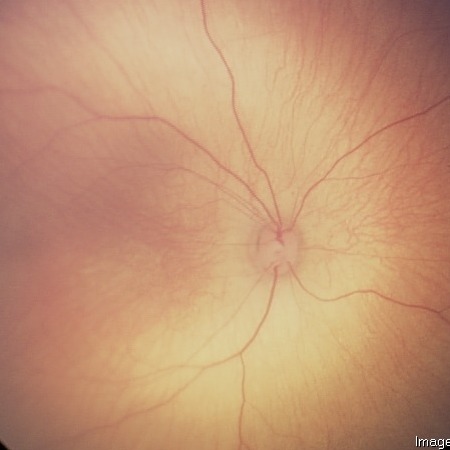
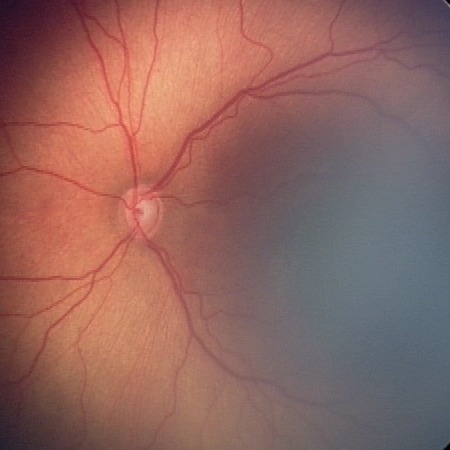
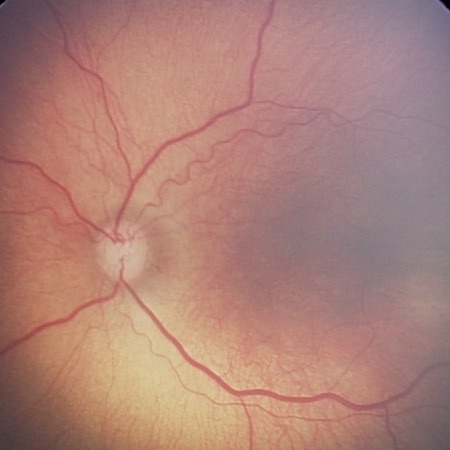
In order to classify retinal images into three categories depending on the level of ROP (plus, preplus and normal/healthy), the marking app was developed. It is a GUI to allow medical doctors to manually label retina images as plus, preplus or normal/healthy. This approach allows us to collect enough training data for classification.
Classification of ROP Disease
- Previously trained U-Net (with Imagenet) network was trained with segmented version of data that we collected.
-
81% accuracy obtained with confusions mostly between Plus/Preplus and Preplus/Normal categories.
- Correctly predicted examples: (Normal, Preplus and Plus Starting from Left to Right)
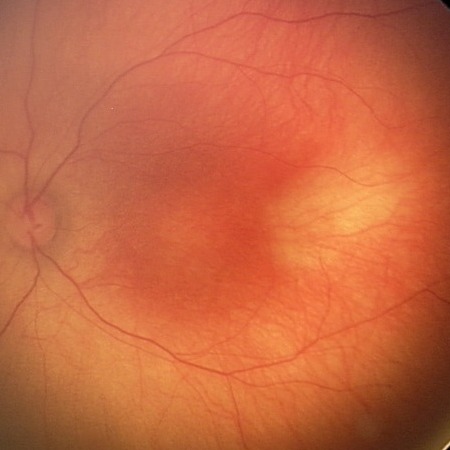
- Wrong predictions: (Left: Normal Predicted as Preplus; Middle: Preplus Predicted as Normal; Right: Preplus Predicted as Plus)